Google Analytics 4 (GA4) is a powerful analytics platform that allows businesses to track user interactions across websites and applications. It provides valuable insights into user behavior and helps optimize marketing strategies. One of the key aspects of GA4 is its organized structure, divided into various tabs, each serving a specific purpose. This article will delve into each tab, explaining their functionalities and how to leverage them for enhanced data analysis and insights.
1. Reports Tab
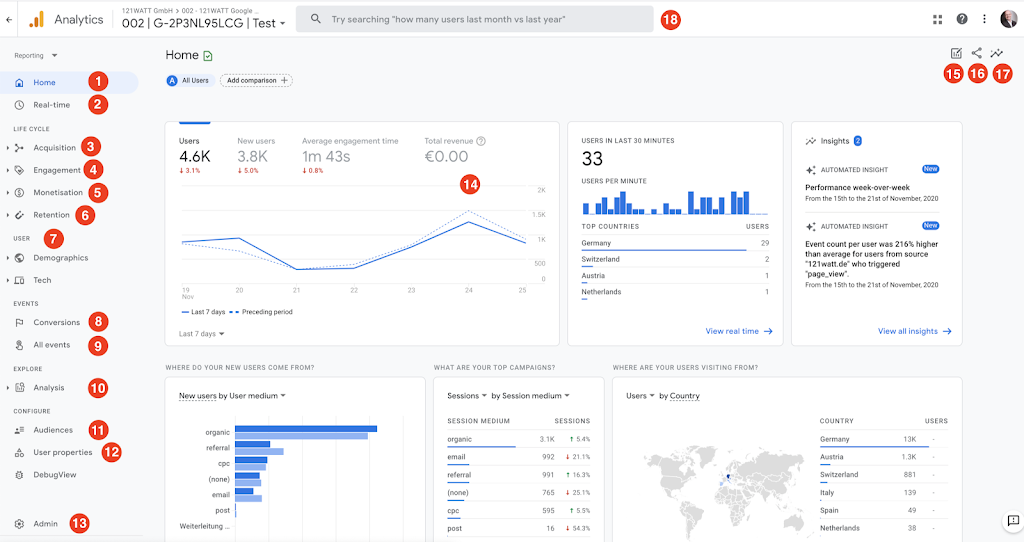
The Reports tab is the heart of GA4, offering pre-configured reports that provide an overview of your data and user interactions. Let’s break down the key components:
a. Real-Time Reports
The Real-Time section allows you to monitor user interactions happening on your site or app in real-time. This feature is beneficial for:
- Live Event Monitoring: Track how many users are currently active, what pages they are viewing, and the events they are triggering. This is especially useful during product launches or marketing campaigns.
- Geographic Insights: See where your active users are located, allowing you to understand regional engagement.
- Source/Medium Tracking: Identify which sources are driving real-time traffic, helping you assess the immediate impact of your marketing efforts.
b. Life Cycle Reports
GA4’s Life Cycle Reports provide insights into different stages of the user journey, categorized into four main areas:
- Acquisition: This report shows how users arrive at your site, detailing traffic sources (organic search, paid ads, social media, etc.). You can analyze which channels bring the most engaged users, helping to allocate resources effectively.
- Engagement: Focused on user interactions, this report tracks metrics like page views, average engagement time, and events. It allows you to identify the most engaging content and understand user behavior on your site.
- Monetization: For businesses that generate revenue online, this report highlights transaction data, revenue sources, and product performance, giving you insights into your sales funnels.
- Retention: This report measures user loyalty by showing how frequently users return to your site or app over time. Retention analysis helps identify successful strategies for maintaining user engagement and increasing lifetime value.
c. User Reports
The User section offers demographic insights about your audience, including:
- Demographics: Understand the age, gender, and interests of your users, helping to tailor marketing strategies to target specific segments.
- Technology: See which devices, browsers, and operating systems your users prefer, enabling you to optimize the user experience across different platforms.
- User Explorer: This feature allows you to analyze individual user journeys, tracking how specific users navigate through your site or app.
The Reports tab is crucial for obtaining a comprehensive view of user behavior, acquisition channels, and overall site performance.
https://varunseo.com/mastering-google-analytics-4-ga4-your-guide-to-better-insights-seo-success/
2. Explore Tab
The Explore tab provides customizable reporting options, enabling you to perform advanced data analysis. This feature is particularly useful for marketers and analysts looking for deeper insights. Here are the main exploration types:
a. Free-Form Exploration
This allows you to create customized reports using a drag-and-drop interface. You can analyze different metrics and dimensions by selecting what you want to view. This exploration is ideal for:
- Custom Comparisons: Analyze user segments and compare their behavior, such as new vs. returning users.
- Multi-Dimensional Analysis: Visualize data across various dimensions to uncover hidden patterns or trends.
b. Funnel Exploration
Funnel Exploration helps you visualize user journeys through specific processes, such as completing a purchase or signing up for a newsletter. This feature allows you to:
- Identify Drop-Off Points: Understand where users abandon the funnel, enabling you to optimize critical paths and reduce churn.
- Test Variants: Analyze different versions of a funnel to see which performs better in terms of conversion rates.
c. Path Exploration
Path Exploration allows you to map out the paths users take on your site, providing insights into navigation patterns. You can use this to:
- Visualize User Journeys: See how users navigate between different pages and events, identifying common paths and deviations.
- Optimize Navigation: Use insights from path analysis to enhance site structure and user experience.
d. Cohort Exploration
This feature enables you to group users based on shared characteristics or behaviors. Cohort analysis is useful for:
- Tracking User Engagement: Monitor how different user groups engage with your content over time.
- Assessing Retention: Evaluate how long users remain engaged and whether certain cohorts exhibit different behaviors.
e. Segment Overlap
Segment Overlap allows you to compare multiple user segments, giving insights into how different groups interact with your site. This can help you:
- Understand Audience Behavior: Identify which segments are more likely to convert or engage, informing marketing strategies.
- Tailor Messaging: Use insights from segment comparisons to develop targeted content and campaigns.
The Explore tab is essential for conducting in-depth analyses and gaining valuable insights that go beyond standard reporting.
3. Advertising Tab
The Advertising tab is designed to integrate your Google Ads data and analyze campaign performance. This tab includes several key components:
a. Conversions
This section tracks how your advertising efforts lead to conversions on your site. You can see:
- Conversion Rates: Measure the effectiveness of your campaigns in driving desired actions, such as purchases or sign-ups.
- Attribution Models: Understand how different marketing channels contribute to conversions, allowing you to allocate budget more effectively.
b. Cost Analysis
In this section, you can view the cost metrics related to your advertising campaigns, such as:
- Return on Investment (ROI): Analyze the cost-effectiveness of campaigns by comparing costs to revenue generated.
- Cost per Acquisition (CPA): Calculate the average cost of acquiring a new customer through your advertising efforts.
c. Attribution
GA4 offers advanced attribution modeling to provide insights into the complete user journey leading to conversions. This allows you to:
- Evaluate Marketing Channels: Understand the role each channel plays in the conversion process, helping you optimize your multi-channel marketing strategy.
- Analyze User Touchpoints: Track user interactions across different platforms and devices to see how they contribute to conversions.
The Advertising tab is crucial for marketers looking to assess and optimize their ad campaigns effectively.
4. Configure Tab
The Configure tab allows you to customize your GA4 setup to better align with your business needs. Key sections include:
a. Events
In GA4, tracking user actions is done through events. The Events section enables you to:
- View Default Events: GA4 automatically tracks certain events like page views, scrolls, and outbound clicks.
- Create Custom Events: Define and track unique events tailored to your business objectives, such as tracking video plays or specific button clicks.
b. Conversions
Marking key events as conversions ensures they are highlighted in reports. You can:
- Identify Important Actions: Designate events that signify significant user interactions, such as form submissions or purchases, as conversions.
- Measure Impact: Track the performance of these conversions to assess your site’s effectiveness in driving key actions.
c. Audiences
Creating audience segments based on user behavior or characteristics allows for targeted marketing efforts. You can:
- Define Custom Audiences: Segment users based on specific criteria, such as recent purchasers or users who visited certain pages.
- Leverage for Remarketing: Use these audiences in advertising campaigns to retarget users based on their previous interactions.
d. Custom Definitions
Custom Definitions enable you to track metrics and dimensions specific to your business. You can:
- Define Custom Metrics: Create metrics that matter to your business goals, such as average order value.
- Add Custom Dimensions: Capture additional user attributes relevant to your analysis, enhancing your understanding of user behavior.
The Configure tab is essential for tailoring GA4 to your unique business requirements, ensuring you collect the most relevant data.
5. Library Tab
The Library tab is where you can manage and customize your reporting setup. This section allows you to:
a. Create Custom Reports
Build reports tailored to your specific needs, focusing on the metrics and dimensions that matter most to your business. This flexibility allows you to prioritize the insights that are most valuable.
b. Edit Report Collections
Organize your reports into collections based on themes, such as user acquisition, engagement, or conversion performance. This makes it easier to access the reports you need quickly.
c. Access Shared Reports
Any reports shared within your organization can be accessed from the Library, fostering collaboration and ensuring everyone is aligned on key metrics and insights.
The Library tab enhances usability and ensures that the most relevant reports are readily available for your team.
Conclusion
Google Analytics 4 (GA4) offers a robust set of tools and features for tracking user behavior and optimizing marketing strategies. By understanding and utilizing each tab effectively, businesses can gain valuable insights into user interactions and overall performance.
- Reports Tab: Provides an organized overview of user behavior and acquisition channels.
- Explore Tab: Offers advanced data analysis through customizable reports.
- Advertising Tab: Integrates ad campaign data and analyzes conversion performance.
- Configure Tab: Customizes GA4 to meet specific business needs.
- Library Tab: Manages and customizes reporting for easier access to insights.
By leveraging these features, businesses can make data-driven decisions that enhance user experiences, optimize marketing efforts, and ultimately drive success.


%20tabs.jpg)


